
Mathematical statistics with applications equips K-12 educators with data analysis tools that transform classroom assessment, student performance tracking, and evidence-based instructional decisions. At its core, this field bridges theoretical probability and real-world problem solving, offering teachers practical methods to interpret test scores, identify learning patterns, and measure intervention effectiveness without requiring advanced mathematics expertise.
You already use statistical thinking when you review student grades, analyze attendance trends, or evaluate whether a new teaching strategy works. Mathematical statistics simply formalizes these intuitions with reliable techniques like hypothesis testing, confidence intervals, and regression analysis. The difference lies in moving from gut feelings to quantifiable evidence that supports differentiated instruction and helps you advocate for your students with data-driven clarity.
The applications in education are immediate and powerful. Teachers analyze formative assessment results to group students by skill level, administrators use enrollment data to allocate resources fairly, and instructional coaches measure professional development impact through pre- and post-intervention comparisons. These aren’t abstract exercises. They’re daily decisions that shape learning outcomes.
What makes mathematical statistics accessible in 2026 is the shift away from complex manual calculations toward interpretation and application. Free digital tools handle the computational work, letting you focus on asking the right questions and understanding what the numbers reveal about your classroom. Statistical literacy has become as essential to effective teaching as lesson planning or classroom management.
This guide breaks down core statistical concepts through an educator’s lens, connecting theory to scenarios you encounter regularly. Whether you’re examining achievement gaps, predicting student success, or evaluating curriculum effectiveness, you’ll gain confidence in using data as a teaching partner rather than viewing it as an administrative burden.
What Mathematical Statistics With Applications Really Means for Educators
When you hear “mathematical statistics with applications,” your first thought might be graduate-level equations and complex theory far removed from your fourth-grade classroom or high school English lessons. Here’s the truth: this field is actually about using rigorous statistical thinking to solve real-world problems, which makes it surprisingly relevant to what you do every day as an educator.
Basic statistics, the kind you might remember from an introductory college course, focuses on calculating measures like mean, median, and standard deviation from data you already have. You’re describing what happened. Mathematical statistics goes deeper by asking why patterns emerge and whether those patterns will hold true beyond your current dataset. It builds the theoretical foundation that explains how statistical methods actually work, which sounds abstract until you realize this understanding helps you make better decisions about your students.
The “applications” component is where educators should pay closest attention. Applied statistics takes those theoretical principles and puts them to work on actual problems. For teachers, this means moving from “my class average is 78%” to “based on this assessment data, I can predict which students will struggle with next week’s material with reasonable confidence.” You’re not just reporting numbers anymore. You’re using statistical reasoning to guide instruction.
- Mathematical Statistics
- The theoretical framework that explains why statistical methods work and under what conditions they produce reliable results. This foundation helps educators understand when they can trust their data interpretations.
- Applied Statistics
- The practical use of statistical methods to solve real problems, from analyzing test scores to evaluating intervention effectiveness. It focuses on choosing and implementing the right tools for specific educational questions.
- Statistical Inference
- Drawing conclusions about larger groups based on smaller samples, such as using one class’s performance to inform decisions about an entire grade level. This helps teachers make evidence-based decisions without needing complete information.
- Data Modeling
- Creating mathematical representations of educational processes to predict outcomes or test theories. Teachers use this when they identify patterns in student behavior or academic progress to anticipate future needs.
The connection to your classroom becomes clear when you consider common teaching scenarios. When you analyze formative assessment results to group students for targeted instruction, you’re applying statistical thinking about variance and distribution. When you evaluate whether a new reading intervention actually improved comprehension scores beyond normal growth, you’re conducting statistical inference. These aren’t hypothetical exercises, they’re the daily work of teaching, now viewed through a statistical lens that makes your decisions more defensible and effective.
The Growing Demand for Statistical Literacy in K-12 Education
How Data-Driven Instruction Changed the Game
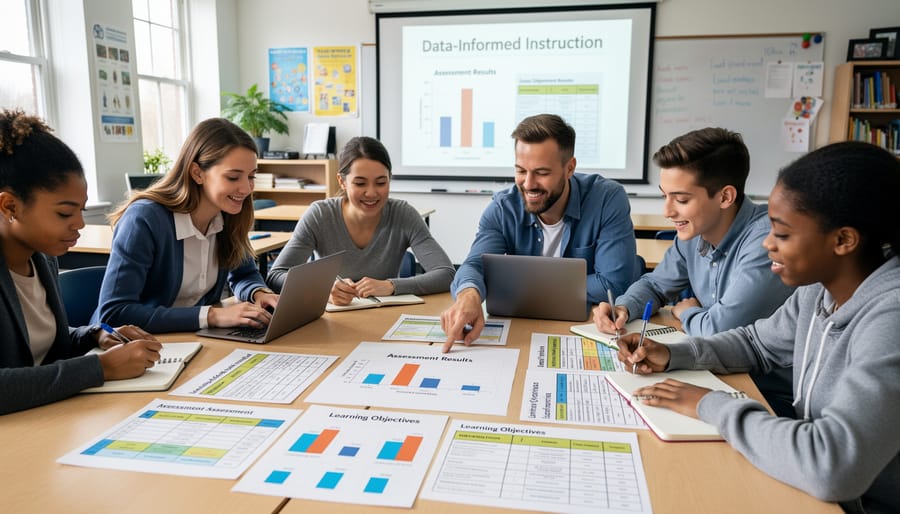
A decade ago, most teachers made instructional decisions based on intuition, experience, and perhaps end-of-unit test scores. Today’s classrooms operate differently. Schools now collect granular data on everything from daily formative assessments to reading fluency rates, behavior incidents, and even student engagement patterns during remote learning sessions. This shift toward data-driven instruction fundamentally changed what teachers need to know.
When you’re looking at a spreadsheet showing thirty students’ quiz scores across twelve standards, calculating the class average tells you almost nothing useful. You need to spot which students cluster together in their misconceptions, identify outliers who need different support, and recognize whether your class shows normal variation or troubling patterns. That requires understanding distributions, variance, and correlation, core concepts from mathematical statistics.
Personalized learning platforms compound this need. Adaptive software generates reports with confidence intervals, growth percentiles, and predictive analytics. Teachers who can’t interpret these metrics risk misunderstanding their students’ actual progress. A student at the 40th percentile isn’t necessarily struggling; context matters. Similarly, intervention decisions shouldn’t rest on whether a student scored two points higher after tutoring, you need to know if that difference is statistically meaningful or random fluctuation.
This isn’t about turning teachers into statisticians. It’s about building enough statistical literacy to use the powerful tools modern education provides without being misled by numbers that look precise but lack meaning.
Statistical Concepts Students Actually Need
Students don’t need a theoretical statistics course to benefit from statistical thinking. Elementary students can grasp probability through coin flips and spinner experiments, learning that patterns emerge from randomness. Middle schoolers benefit from hands-on sampling activities, surveying classmates about favorite subjects or comparing small versus large sample sizes to see how reliability changes. By high school, students should interpret box plots, understand margin of error in polls, and recognize correlation versus causation in news stories.
The National Council of Teachers of Mathematics emphasizes data analysis and probability as core mathematical practices that span grade levels. Real-world problem solving matters most: calculating sports statistics, analyzing environmental data from local streams, or designing experiments to test which study method works best. These applications build intuition about variability, evidence, and informed decision-making, skills students carry into college research projects, workplace analytics, and everyday critical thinking. When educators understand the progression from counting M&Ms by color to hypothesis testing, they can scaffold statistical reasoning throughout a student’s educational journey.
Practical Applications Every Educator Can Use
Reading Student Data with Statistical Eyes
When you look at a spreadsheet of quiz scores or reading levels, you’re seeing more than numbers, you’re seeing stories about learning that statistical thinking can help you interpret. The key shift is moving from “what happened” to “what does this mean for instruction.”
Start by noticing the spread, not just the average. If your class average on a math assessment is 75%, that single number hides crucial information. Are most students clustered near 75%, or do you have a wide range from 40% to 95%? Statistical thinking teaches you to look for variability first. When scores cluster tightly, your whole-class instruction likely worked. When they’re scattered, you need differentiated approaches, some students need enrichment while others require foundational support.
Pattern recognition becomes your instructional compass. Look for consistent struggles across multiple students on specific question types. If eight students missed the same inference question, that’s not random chance, it’s a teaching opportunity. Statistical awareness helps you distinguish signal from noise: which patterns demand immediate action versus which reflect normal variation in learning.
The transition to practical data use happens when you ask better questions of your data. Instead of “Did they pass?”, try “What does this distribution tell me about my pacing?” or “Which subgroups need targeted intervention?” You don’t need sophisticated formulas. Simple statistical habits, comparing distributions, tracking trends over time, questioning outliers, transform raw numbers into actionable teaching insights that directly improve student outcomes.
Bringing Statistical Thinking into Your Lessons
Statistical thinking isn’t confined to math class, it’s a mindset that enriches learning across your entire curriculum. When you help students see data and patterns in multiple contexts, you’re building the analytical foundation they’ll use throughout their lives.
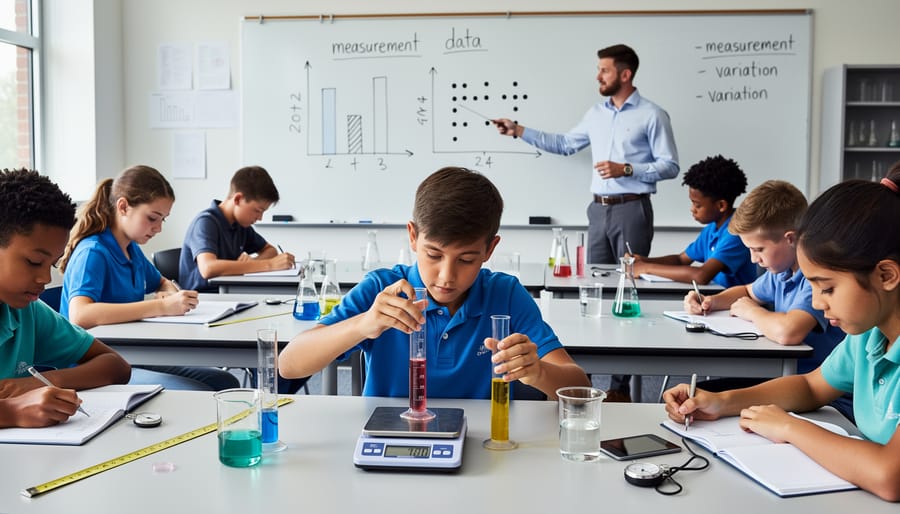
In science, statistical reasoning transforms basic experiments into genuine inquiry. Instead of following cookbook procedures, students can design their own trials, collect measurements, and determine whether results show real differences or normal variation. A fifth-grade class testing plant growth under different light conditions learns to repeat trials, calculate averages, and discuss why their bean plants don’t all grow to identical heights. This moves beyond “what happened” to “what does this tell us?”
Social studies offers rich opportunities for survey design and interpretation. Middle schoolers investigating community opinions about a local issue learn that how you ask a question shapes the answers you get. They discover sampling challenges firsthand, why surveying only their friends produces different results than a random selection. Analyzing historical census data or election results brings abstract numbers into human stories while teaching critical evaluation of claims.
Even language arts benefits from statistical approaches. Students can analyze word frequency in different authors’ works, track character appearances across a novel, or examine sentiment patterns in poetry collections. Eighth graders comparing vocabulary complexity between news sources engage in textual analysis that’s both literary and quantitative.
The key is starting with questions students care about, then showing how data helps answer them. You don’t need sophisticated formulas, simple tallies, bar graphs, and discussions about “most,” “least,” and “typical” build statistical intuition. When combined with real-time feedback on student understanding, you can adjust your approach as they develop these cross-curricular skills.
Building Your Statistical Toolbox as an Educator
Professional Development Opportunities Worth Your Time
Start with free, high-quality options that fit into your existing schedule. The American Statistical Association offers educator-focused webinars throughout the year, many recorded for on-demand viewing. These sessions connect statistical concepts directly to classroom practice without requiring advanced math backgrounds. Look for workshops labeled “statistics for educators” rather than “statistics for statisticians”, the framing matters.
Online platforms like Coursera and edX host accessible courses in data literacy and applied statistics designed specifically for teachers. Many allow you to audit content free before committing to certification. Choose programs that emphasize interpretation over calculation, focusing on what the numbers mean for student learning rather than complex formulas.
Your district likely offers professional development related to assessment data analysis. These workshops provide practical training while addressing data privacy ethics and compliance requirements specific to your school context. The familiar setting helps you apply statistical thinking to data you already collect.
Consider micro-credentials in data literacy or assessment analysis. These bite-sized programs let you build skills incrementally without overwhelming time commitments. Organizations like Digital Promise offer educator-designed pathways that recognize your growing expertise.
Summer institutes provide immersive experiences when you have more flexibility. Programs through universities or education nonprofits often combine statistical foundations with curriculum development, letting you create materials you’ll actually use in September. The investment of concentrated time yields lasting practical benefits.
Connecting with Other Data-Minded Educators
Learning statistical thinking doesn’t happen in isolation. The most effective way to build your confidence with data interpretation is by connecting with colleagues who share similar questions and challenges. When you’re puzzling over student assessment patterns or trying to determine if an intervention truly made a difference, having a trusted group to consult makes all the difference.
Professional learning communities focused on data literacy create safe spaces where educators can share their “aha” moments and their confusions without judgment. These groups work best when they meet regularly, whether in person after school or through scheduled video calls, and maintain a practical focus. Instead of theoretical discussions, participants bring real classroom data, walk through their analysis together, and offer different interpretations that strengthen everyone’s thinking.
Online forums and communities extend this support beyond your building. Platforms like Teach Find host vibrant discussions where educators across grade levels exchange statistical insights, recommend tools for visualizing student data, and troubleshoot common interpretation mistakes. These communities prove particularly valuable when you’re the only teacher in your school wrestling with certain data questions.
The key is finding or creating PLCs that work for your schedule and learning style. Some educators thrive in structured book studies around statistical texts, while others prefer informal coffee chats where they bring data puzzles to solve collaboratively. Either way, surrounding yourself with data-minded colleagues accelerates your growth and reminds you that developing statistical literacy is a shared professional journey.
Common Concerns and How to Address Them
It’s natural to feel hesitant when encountering mathematical statistics for the first time. Many educators worry they don’t have the right background or time to engage meaningfully with statistical concepts. The truth is, you don’t need to become a statistician to benefit from statistical thinking in your classroom.
The most common concern is mathematical preparation. Teachers often assume mathematical statistics requires advanced calculus or specialized training. In reality, the statistical reasoning that improves teaching practice builds on concepts you already use, comparing groups, noticing patterns, understanding what’s typical versus unusual. You’re applying statistical thinking when you recognize that one student’s test score represents an outlier or when you adjust instruction based on formative assessment trends. Building from that intuitive foundation is entirely feasible.
Time constraints present another valid worry. Adding statistical analysis to already-packed schedules sounds overwhelming. Start small: choose one data point you already collect, like exit ticket responses or reading levels, and spend five minutes looking for patterns rather than just recording numbers. This incremental approach lets statistical habits develop naturally without requiring separate preparation blocks.
Do I need advanced math training to use statistical thinking in my classroom?
No. The statistical reasoning that benefits educators builds on pattern recognition and comparison skills you already use daily. Formal coursework helps but isn’t a prerequisite for applying basic statistical principles to instruction.
How much time does developing statistical literacy actually require?
Begin with five-minute reflections on data you already collect. Meaningful progress comes from consistent small practices, not lengthy study sessions.
What if I teach young children who aren’t ready for statistics?
Statistical thinking benefits you as the teacher, understanding student variability, interpreting assessment patterns, making data-informed decisions, regardless of your students’ grade level. Elementary students also engage with foundational concepts through sorting, graphing, and comparing.
Where should I start if this feels overwhelming?
Pick one familiar dataset from your classroom and ask a simple question: What’s typical here, and what stands out? This single question opens statistical thinking without requiring new tools or training.
Teachers without strong math backgrounds sometimes avoid statistical conversations entirely, fearing they’ll make mistakes. Remember that developing statistical literacy is professional growth, not remediation. Every educator brings valuable observational skills and content expertise to data interpretation. Your instructional experience matters more than your comfort with formulas. When questions arise that exceed your current knowledge, treating them as learning opportunities models exactly the growth mindset we encourage in students.
Understanding mathematical statistics with applications isn’t about becoming a data scientist overnight. It’s about equipping yourself with practical tools that make you a more effective educator. When you can interpret student performance data with confidence, design classroom experiments that actually measure what you’re teaching, or help students see the real-world relevance of probability and inference, you’re creating richer learning experiences that stick.
The beauty of this journey is that you don’t have to tackle it alone or all at once. Start with one small application, maybe analyzing your next quiz results with a fresh statistical lens, or incorporating a simple data collection project into your existing curriculum. Each step builds your confidence and expands what’s possible in your classroom.
Your professional growth in statistical literacy benefits everyone: you make more informed instructional decisions, your students develop critical thinking skills they’ll use for life, and you model the lifelong learning you encourage in them. Whether you’re just beginning to explore these concepts or looking to deepen existing skills, the resources and community support are there.
Connect with fellow educators through interactive tools and community forums where you can share insights, ask questions, and discover what’s working in classrooms like yours. Statistical thinking is becoming essential across K-12 education, and you’re already taking the right step by investing in your own understanding. The confidence you build today will serve your students for years to come.