
Most educators should start with descriptive statistics for everyday classroom data analysis, then layer in inferential statistics when drawing conclusions about broader student populations or evaluating program effectiveness. Descriptive statistics summarize what happened in your classroom right now, the scores, patterns, and trends you can see directly, while inferential statistics help you predict, generalize, and make evidence-based decisions about students you haven’t tested yet or outcomes you want to influence.
This distinction matters tremendously in K-12 settings. When you calculate your class’s average test score or create a grade distribution chart, you’re using descriptive statistics to understand the group sitting in front of you. When you want to know whether your new reading intervention will likely work with next year’s students, or if the improvement you saw was genuine progress rather than chance variation, you need inferential statistics.
The challenge for many educators isn’t choosing between these approaches but recognizing when each serves your teaching goals. A third-grade teacher tracking weekly spelling scores needs different tools than a curriculum coordinator evaluating district-wide literacy gains. Both are doing valuable statistical work, but the questions they ask and the certainty they can claim differ fundamentally.
Professional development opportunities continue expanding in 2026, with Statistics Canada offering data literacy training, webinars, and statistical courses tailored to educators. The Canadian Stata Conference in Vancouver this November brings together practitioners working on inference challenges, while programs like McMaster Continuing Education’s DAT 101 course introduce both descriptive and basic inferential methods in accessible formats.
Understanding these two branches of statistics empowers you to make stronger instructional decisions, communicate student progress more effectively, and contribute meaningfully to school-wide improvement efforts. The good news? You already use descriptive statistics every time you grade assignments or track attendance. Building confidence with inferential methods simply extends skills you’ve already developed.
At-a-Glance: Descriptive vs. Inferential Statistics
| Characteristic | Descriptive Statistics | Inferential Statistics |
|---|---|---|
| Purpose | Summarize and organize data you already have | Make predictions and draw conclusions about larger populations |
| Data Scope | Works with complete datasets (entire class, full year) | Uses samples to generalize to broader groups |
| Common Techniques | Mean, median, mode, range, charts, graphs | Hypothesis testing, confidence intervals, regression analysis |
| Classroom Examples | Average test score, attendance percentages, grade distributions | Comparing intervention effectiveness, predicting student outcomes |
| When to Use | Reporting what happened, tracking progress, parent conferences | Evaluating programs, conducting action research, testing teaching methods |
Most K-12 educators rely on descriptive statistics for everyday classroom tasks like calculating grade averages, creating visual summaries of student performance, and tracking attendance patterns. These methods require no advanced mathematical training and directly answer questions about what your current data shows. Inferential statistics becomes relevant when you need to evaluate whether a new teaching strategy actually works better than your previous approach, or when participating in school-wide research projects that aim to draw broader conclusions from limited data samples.
Understanding Both Approaches
What Descriptive Statistics Is

Descriptive statistics is the branch of statistics for educators that focuses on summarizing and presenting data in a clear, understandable format. Rather than making predictions or drawing conclusions beyond your dataset, descriptive statistics helps you organize what you already know about your students, classroom, or school. It answers questions like “What did my class average on the unit test?” or “How many students were absent this month?” without attempting to predict future outcomes.
The power of descriptive statistics lies in its ability to transform raw numbers into meaningful insights. When you calculate the average homework completion rate or create a bar chart showing reading level distribution, you’re using descriptive statistics measures to make sense of your classroom data. These tools are accessible and practical, requiring only basic arithmetic and an understanding of a few key concepts.
- Mean
- The arithmetic average calculated by adding all values and dividing by the count. Use it to report typical test scores or average assignment grades.
- Median
- The middle value when data is arranged in order. It’s more resistant to outliers than the mean, making it useful when a few very high or low scores might skew results.
- Mode
- The most frequently occurring value in your dataset. Helpful for identifying the most common reading level or the grade most students earned.
- Range
- The difference between the highest and lowest values. It shows the spread in your classroom data, such as the gap between your strongest and weakest performers.
- Standard Deviation
- A measure of how much individual scores vary from the mean. A low standard deviation means scores cluster tightly around the average.
In your classroom, descriptive statistics appears daily. You might calculate the class average on a quiz, determine what percentage of students met a learning target, or create a frequency table showing how many students fall into each proficiency band. These summaries help you communicate with parents, identify patterns in student performance, and adjust your instruction based on concrete evidence from your own classroom data.
What Inferential Statistics Is

Inferential statistics lets you make educated guesses about a larger group by studying a smaller sample. When you survey 30 students about their reading habits and use those results to draw conclusions about all 500 students in your school, you’re using inferential methods to extend what you know beyond your direct observations.
This approach relies on probability theory to determine how confident you can be in your conclusions. If you test a new teaching strategy with one class and want to know whether it would work across all your classes, inferential statistics provides the mathematical framework to make that judgment. You’re essentially asking: “Based on what I observed here, what can I reasonably expect elsewhere?”
The foundation of inferential statistics rests on several key concepts that work together to support predictions from sample data:
- Hypothesis Testing
- A method for deciding whether your data supports a specific claim about a population. For example, testing whether a new intervention genuinely improves reading scores versus being due to chance.
- Confidence Intervals
- A range of values that likely contains the true population value, expressed with a confidence level such as 95%. Instead of saying “the average is 82,” you might say “the average is between 78 and 86 with 95% confidence.”
- Sampling
- The process of selecting a representative subset from a larger population. How you choose your sample directly affects the reliability of your conclusions.
- P-values
- A number between 0 and 1 indicating the probability that your results occurred by random chance alone. A p-value below 0.05 typically suggests your findings are statistically significant.
- Correlation
- A statistical relationship between two variables that helps identify patterns, though it doesn’t prove one causes the other.
In K-12 settings, inferential statistics becomes particularly valuable when conducting action research. You might compare reading comprehension scores between two groups to evaluate whether a new literacy program outperforms the existing approach, or analyze attendance patterns to predict which students face higher dropout risk.
Comparing the Two Approaches Side-by-Side
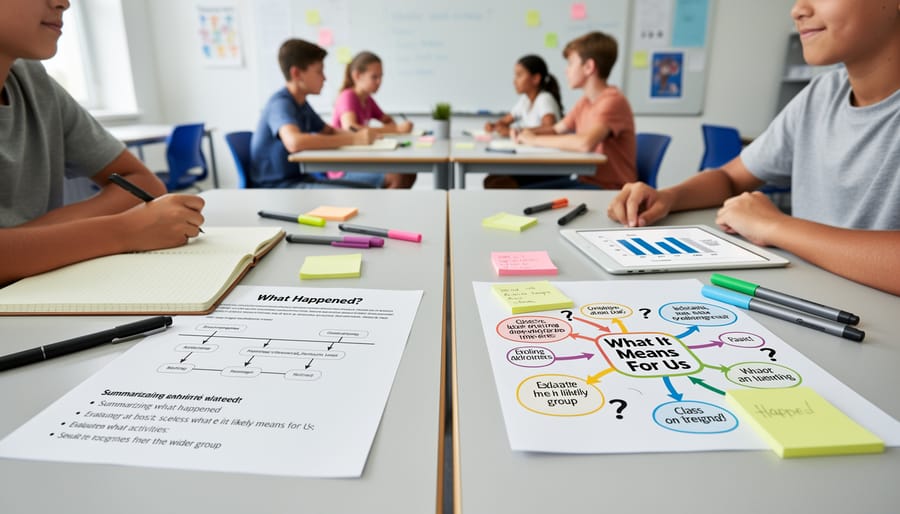
Purpose and Goals
Descriptive statistics aims to summarize what has already happened in your classroom. When you calculate the average quiz score, identify the most common incorrect answer, or create a grade distribution chart, you’re describing the data you have in front of you. The goal is clarity: presenting facts about your specific class, semester, or assignment in ways that make patterns visible and understandable.
Inferential statistics, by contrast, looks beyond the immediate data to make broader claims. It answers questions like “Will this intervention work with next year’s students?” or “Does this teaching strategy produce significantly better outcomes than the alternative?” The purpose here is prediction and generalization, using a sample (perhaps your current class) to draw conclusions about a larger population (all students who might encounter this material). While descriptive methods tell you what your data shows, inferential techniques help you test hypotheses and make evidence-based decisions about future teaching practices.
Data Requirements and Scope
The scope of your data determines which statistical approach applies. Descriptive statistics works with complete datasets, every student in your class, all the test scores from this semester, or the total attendance records for the school year. You’re not making assumptions or drawing conclusions beyond the data in front of you. When you calculate the average test score for your Grade 5 class or create a chart showing the distribution of homework completion rates, you’re describing exactly what happened with that specific group.
Inferential statistics operates differently. It relies on representative samples to make broader claims about entire populations. Rather than analyzing all students in a district, you might study a sample of 100 students to draw conclusions about the district’s 5,000 students. This approach becomes necessary when examining every individual is impractical or impossible. Educational researchers use inferential methods to test whether findings from a pilot program will likely hold true across multiple schools. Understanding the distinction between descriptive versus inferential statistics helps educators recognize when they have enough data to describe outcomes directly versus when they need sampling techniques to generalize findings.
Complexity and Prerequisites
Descriptive statistics requires minimal mathematical background, making it accessible for teachers new to data analysis and appropriate for introducing students to statistical thinking. You can calculate measures like mean, median, and mode with basic arithmetic, and create visual displays like bar charts or histograms without advanced training. Most educators can confidently use descriptive methods after a brief introduction to the concepts.
Inferential statistics demands substantially more mathematical foundation. You need to understand probability theory, sampling distributions, confidence intervals, and hypothesis testing, topics that typically require college-level statistics coursework. Concepts like p-values, significance levels, and statistical power aren’t intuitive, and misinterpreting them can lead to incorrect conclusions about your data. Courses like McMaster Continuing Education’s DAT 101, which covers basic inferential statistics alongside probability concepts, provide the necessary groundwork for teachers ready to move beyond descriptive analysis.
This complexity gap means most K-12 educators will rely on descriptive statistics for daily classroom use, while reserving inferential methods for specific research projects where professional development or collaboration with colleagues experienced in statistical analysis can support accurate application.
Applications in K-12 Education
In your classroom, descriptive statistics helps you track daily performance and communicate progress clearly. You’ll use it to calculate class averages on unit tests, create grade distribution charts for parent-teacher conferences, and summarize attendance patterns across marking periods. When reviewing real-time student data during formative assessments, descriptive measures show you immediately which concepts students have mastered and where reteaching is needed.
- Report cards and progress reports that summarize individual student achievement
- Standardized test score summaries showing class performance distributions
- Professional learning community data analyzing grade-level trends
- Action research projects evaluating the impact of new teaching strategies
Inferential statistics comes into play when you’re evaluating broader questions about effectiveness. School administrators use it to determine whether a new math curriculum significantly improved student outcomes compared to the previous program. If you’re conducting action research on whether flexible seating arrangements affect student engagement, inferential methods help you decide whether observed differences are statistically meaningful or simply due to chance. District teams rely on these techniques when comparing intervention programs across schools or predicting future enrollment trends based on demographic samples.
Which Approach Should You Choose?

Choose Descriptive Statistics When…
Descriptive statistics is your go-to tool whenever your goal is to understand and communicate what has already happened with the data in front of you. It’s the straightforward choice for everyday classroom tasks where you need to summarize, organize, and present information clearly without drawing broader conclusions.
You’ll rely on descriptive statistics regularly for:
- Summarizing student performance on quizzes, tests, or assignments to identify class averages and grade distributions
- Creating visual displays, bar charts, histograms, pie graphs, for parent-teacher conferences or open houses
- Introducing basic statistical concepts to students through hands-on data collection projects with tangible results
- Preparing progress reports that show concrete trends in attendance, participation, or skill mastery over a grading period
- Organizing survey results from students or parents where you’re reporting what respondents actually said
- Tracking individual student growth with measures of central tendency that highlight improvement patterns
The defining characteristic: you’re working with complete data from your actual classroom or school, not trying to make predictions or generalize beyond what you’ve directly observed. If you can answer your question by calculating a mean, creating a frequency table, or building a graph from the numbers you already have, descriptive statistics is the right approach. It requires no sampling theory, no probability calculations, and no complex assumptions, just clear organization and presentation of the facts your students and their families need to see.
Choose Inferential Statistics When…
Inferential statistics becomes essential when you need to draw conclusions beyond your immediate classroom data or evaluate whether an educational change produces meaningful results. This approach lets you make evidence-based predictions about student outcomes and measure intervention effectiveness across different groups.
- You’re conducting action research to determine whether a new teaching strategy improves student performance across your entire grade level, not just the sample group you tested
- You need to evaluate whether differences in learning outcomes between two instructional approaches are statistically significant or simply due to chance variation
- You’re collaborating on research-backed assessment initiatives that require testing hypotheses about student achievement patterns
- You want to predict future student performance based on current assessment data and identify students who may need additional support
- You’re comparing the effectiveness of different interventions to make informed decisions about which programs to continue or expand
Inferential methods require probability knowledge and understanding of sampling theory, but they unlock powerful insights about what works in your classroom. When you move beyond describing what happened to explaining why it happened and predicting what might happen next, inferential statistics becomes your primary analytical tool.
Using Both Together
In practice, effective data-driven instruction relies on both statistical approaches working together. You’ll typically start with descriptive statistics to understand what your data shows: calculating class averages, identifying the range of scores, or creating charts that reveal patterns in student performance. This foundational summary tells you what happened in your classroom.
Once you’ve established that descriptive baseline, inferential statistics allows you to take the next step. You can test whether an observed improvement is statistically significant or likely due to chance, predict future outcomes based on current trends, or determine if results from a pilot group might apply to your entire grade level. For instance, after calculating that your intervention group’s average score increased by 12 points (descriptive), you’d use inferential methods to assess whether that difference is meaningful enough to justify expanding the intervention schoolwide.
This sequential approach mirrors how educational research operates: describe first, then infer.
Building Your Statistics Skills: Professional Development Opportunities
Strengthening your statistical skills doesn’t require going back to graduate school. Multiple accessible pathways exist for K-12 educators at every skill level, from complete beginners to teachers ready to tackle research-grade tools.
Statistics Canada provides a practical starting point through their diverse training offerings. Their programs include data literacy training, statistical courses, webinars, and workshops designed for educators who need to work with real-world data. These sessions cover both fundamental descriptive techniques and introductory inferential methods, allowing you to build competence progressively without overwhelming prerequisites.
For structured learning with academic credit potential, McMaster University’s Continuing Education offers DAT 101, a comprehensive course covering descriptive statistics, basic inferential statistics, linear regression, and probability concepts. This format works well for teachers who prefer guided instruction with clear learning outcomes and practical applications.
The 2026 Canadian Stata Conference presents an opportunity to engage with statistical software used in professional research. Taking place in Vancouver on 5-6 November (8:00 a.m. to 5:00 p.m. PST both days), this conference connects educators with advanced statistical methods and the practitioners who use them daily. While Stata represents a higher learning curve than spreadsheet-based analysis, attending exposes you to what comprehensive data analysis looks like beyond classroom basics.
Choose your entry point based on current comfort level. If descriptive statistics still feels unfamiliar, start with Statistics Canada workshops. If you’re ready to explore inferential methods and research applications, consider structured courses or specialized conferences that match your professional goals.
Frequently Asked Questions
Can I use descriptive statistics with small class sizes?
Absolutely. Descriptive statistics works perfectly with small datasets like individual classroom rosters of 20-30 students. You’re summarizing the complete group you’re teaching, not sampling from a larger population, so class size doesn’t limit its usefulness for tracking grades, attendance, or assignment completion.
Do I need special software to apply these statistical methods?
Not for most classroom applications of descriptive statistics. Basic spreadsheet programs like Excel or Google Sheets handle calculations for mean, median, mode, and simple visualizations. Inferential statistics often benefits from specialized tools, but many K-12 educators start with spreadsheet functions before exploring dedicated statistical software.
What’s the minimum statistics knowledge I need to teach data literacy to my students?
A solid grasp of descriptive statistics, understanding mean, median, mode, range, and how to create bar graphs and histograms, equips you to introduce data literacy concepts at the elementary and middle school levels. Courses like McMaster’s DAT 101 cover these foundations alongside basic inferential concepts if you want to expand your skills.
When should my students learn inferential statistics versus descriptive statistics?
Most K-12 curricula introduce descriptive statistics in elementary grades through data collection and graphing activities, building toward calculating averages in middle school. Inferential concepts typically appear in high school mathematics, where students have the algebra foundation to understand probability, sampling, and making predictions from data.
These questions reflect concerns many educators share when they’re developing their own statistical literacy or planning data units for students. The distinction between describing what you observe and predicting what might happen connects directly to how we scaffold mathematics learning, starting with concrete, observable patterns before moving to abstract reasoning.
If you’re wondering whether your current statistics knowledge is sufficient for your grade level, consider what your students need to do with data. Elementary teachers focusing on collecting, organizing, and displaying information rely almost entirely on descriptive methods. High school teachers preparing students for science fair projects or social studies research might encounter situations where understanding the difference between a class average and a prediction about future performance becomes relevant. Neither approach is more important; they serve different purposes in your teaching toolkit.
Both descriptive and inferential statistics deserve a place in your teaching toolkit, and you don’t need to master everything at once. Most days, you’ll rely on descriptive methods to summarize grades, track attendance, and communicate progress clearly to students and parents. These foundational skills give you immediate, actionable insights from your classroom data.
Inferential statistics becomes relevant when you’re evaluating whether a new intervention truly works, comparing teaching strategies across groups, or contributing to broader educational research. You might use it occasionally rather than daily, but when you do, it adds depth to your professional practice.
The good news? You’re not alone in building these skills. Thousands of educators are strengthening their statistical literacy right now. Join the Teach Find community forums to share your data analysis questions, swap practical strategies for using statistics in K-12 settings, and learn from colleagues who’ve navigated similar challenges. Whether you’re calculating your first class average or designing an action research project, connecting with fellow educators helps you grow your confidence and competence with real-world support.